| trait | R² | p-value |
|---|---|---|
| intelligent | 0.87 | < 0.001 |
| educated | 0.80 | < 0.001 |
| pleasant | 0.79 | < 0.001 |
| self-confident | 0.73 | < 0.001 |
| prestigious | 0.73 | < 0.001 |
| friendly | 0.67 | < 0.001 |
Multilingual perspective in perceptions of Norwegian accents
Kamil Malarski, Magdalena Wrembel, Kamil Kaźmierski, Witosław Awedyk
The 13th International Conference on Third Language Acquisition and Multilingualism
29-31 August 2024
norwegian-accents-iam2024.netlify.app


Accent and dialect variation in Norway
- High dialectal variation across all linguistic domains i.e. morphosyntax, phonology, lexicon
- Four broad dialect areas, in fact many more, including sociolects (Helleland and Papazian 2005)
- South-Eastern accents seen as the most standard (Johnsen 2015)
- Inclusivity towards dialects
Dialectal areas
- Western Norwegian (Vestnorsk)
- Eastern Norwegian (Østnorsk)
- Trøndelag dialect (Trøndersk)
- Northern Norwegian (Nordnorsk)
Kristoffersen, Gjert. 2000. The phonology of Norwegian. Oxford: OUP.
Why some accents are seen as better or worse than others
- Accents as indexes of how people from the region are seen
- Dependent on salient, easily identifiable linguistic features (Llamas et al. 2016)
- The person “down the street” will always have a stronger accent than the person you are talking to (Preston and Niedzielski 2003)
- Voice parametrics (f0 especially, creaky voice)
- Intelligibility + mergers potentially causing misunderstandings (Labov 2010)
Perceptions of Norwegian accents (1/2)
- Stratified socially (Johnsen 2015)
- Western Oslo accents more prestigious than working-class or multicultural Oslo accents (Aasheim 1995, Johnsen 2015, Svendsen and Røyneland 2008)
- Northern Norwegian accents perceived more negatively than Southern (Sollid 2014)
Perceptions of Norwegian accents (2/2)
- Mixing or switching between dialects seen negatively (Røyneland 2017)
- Non-Oslo dialects viewed as more Norwegian (Røyneland 2017)
- Boys with foreign appearance seen as less Norwegian when using Oslo dialect than when using other dialects (Røyneland 2017: 101)
Previous studies :: methods
- A lot of studies on how upper / West Oslo accents and dialects are perceived, both using the verbal guise technique, as well as surveys in different forms (Dahl 2002; Jensen 2006: 73, Lund 2006, Hult 2008, Kristiansen 1995)
- Nine Norwegian accents tested on a scale from ‘nice’ to ‘ugly’ (Voje 1979)
Previous studies :: findings
- Positive attitudes in Tromsø towards other dialects (Satermo and Sollid 2021)
- Changing one’s dialect seen as incorrect (Satermo and Sollid 2021)
- Negative attitudes by urban Vika speakers towards upper Oslo dialects (Jensen 2006, Lund 2006)
Our Study
Research questions
- Are some accents of Norwegian perceived differently than others?
- Do L3/Ln learners of Norwegian attribute similar aesthetic judgments to Norwegian speech as L1 Norwegian listeners do? Does acquisition setting play a role?
- Are L3/Ln learners able to identify the origins of the accents in line with L1 speakers?
Design
- Online survey in Qualtrics
- Reading passage in Norwegian (Nordavinden og sola from the Norwegian dialects database www.hf.ntnu.no/nos)
- Selected speech samples
- 10 middle-aged native Norwegians (5 f, 5 m) from five dialect areas: the Tromsø area, Trondheim, Stavanger, Kristiansand, and Oslo
- 4 controls: non-native accents of Norwegian of different strength (L1 Polish)
- 10 middle-aged native Norwegians (5 f, 5 m) from five dialect areas: the Tromsø area, Trondheim, Stavanger, Kristiansand, and Oslo
Our data (L1 NO)
Our data (L3 NO)
Procedure
7-point Likert scale:
- Education level
- Pleasantness
- Intelligence
- Prestige
- Friendliness
- Self-confidence
- Distance / proximity
Open questions:
- Likes / dislikes
- Characteristic features
- Region of origin of speaker
Samples presented in randomized order
Duration: ca. 20 mins
Participants :: 3 groups
- Polish instructed L3/Ln learners of Norwegian living in Poland
- Polish naturalistic L3/Ln learners of Norwegian residing in Norway
- Norwegian native speakers as controls
Participants :: profiles
Analyses
- Likert scale ratings
- Joint group analysis
- Across-group comparison
- Across-accent comparison
- Attitudes to individual accents (likes/dislikes)
- Accent identification
- Characteristic features of accents (qualitative)
Statistical analysis (1/2)
- A Principal Component Analysis (implemented in FactoMineR [Lê et al. 2008])
- to identify the underlying dimensions behind ratings on the six traits
- Three relevant components determined based on a visual inspection of a scree plot
Statistical analysis (2/2)
- Three mixed-effects linear regression models fitted with lme4 (Bates et al. 2015),
- response variable: one of the respective components
- fixed effects: region, rater group, region by rater group interaction
- by-participant and by-voice random intercepts
- Post-hoc pairwise comparisons (with Tukey correction) performed with emmeans (Lenth 2024)
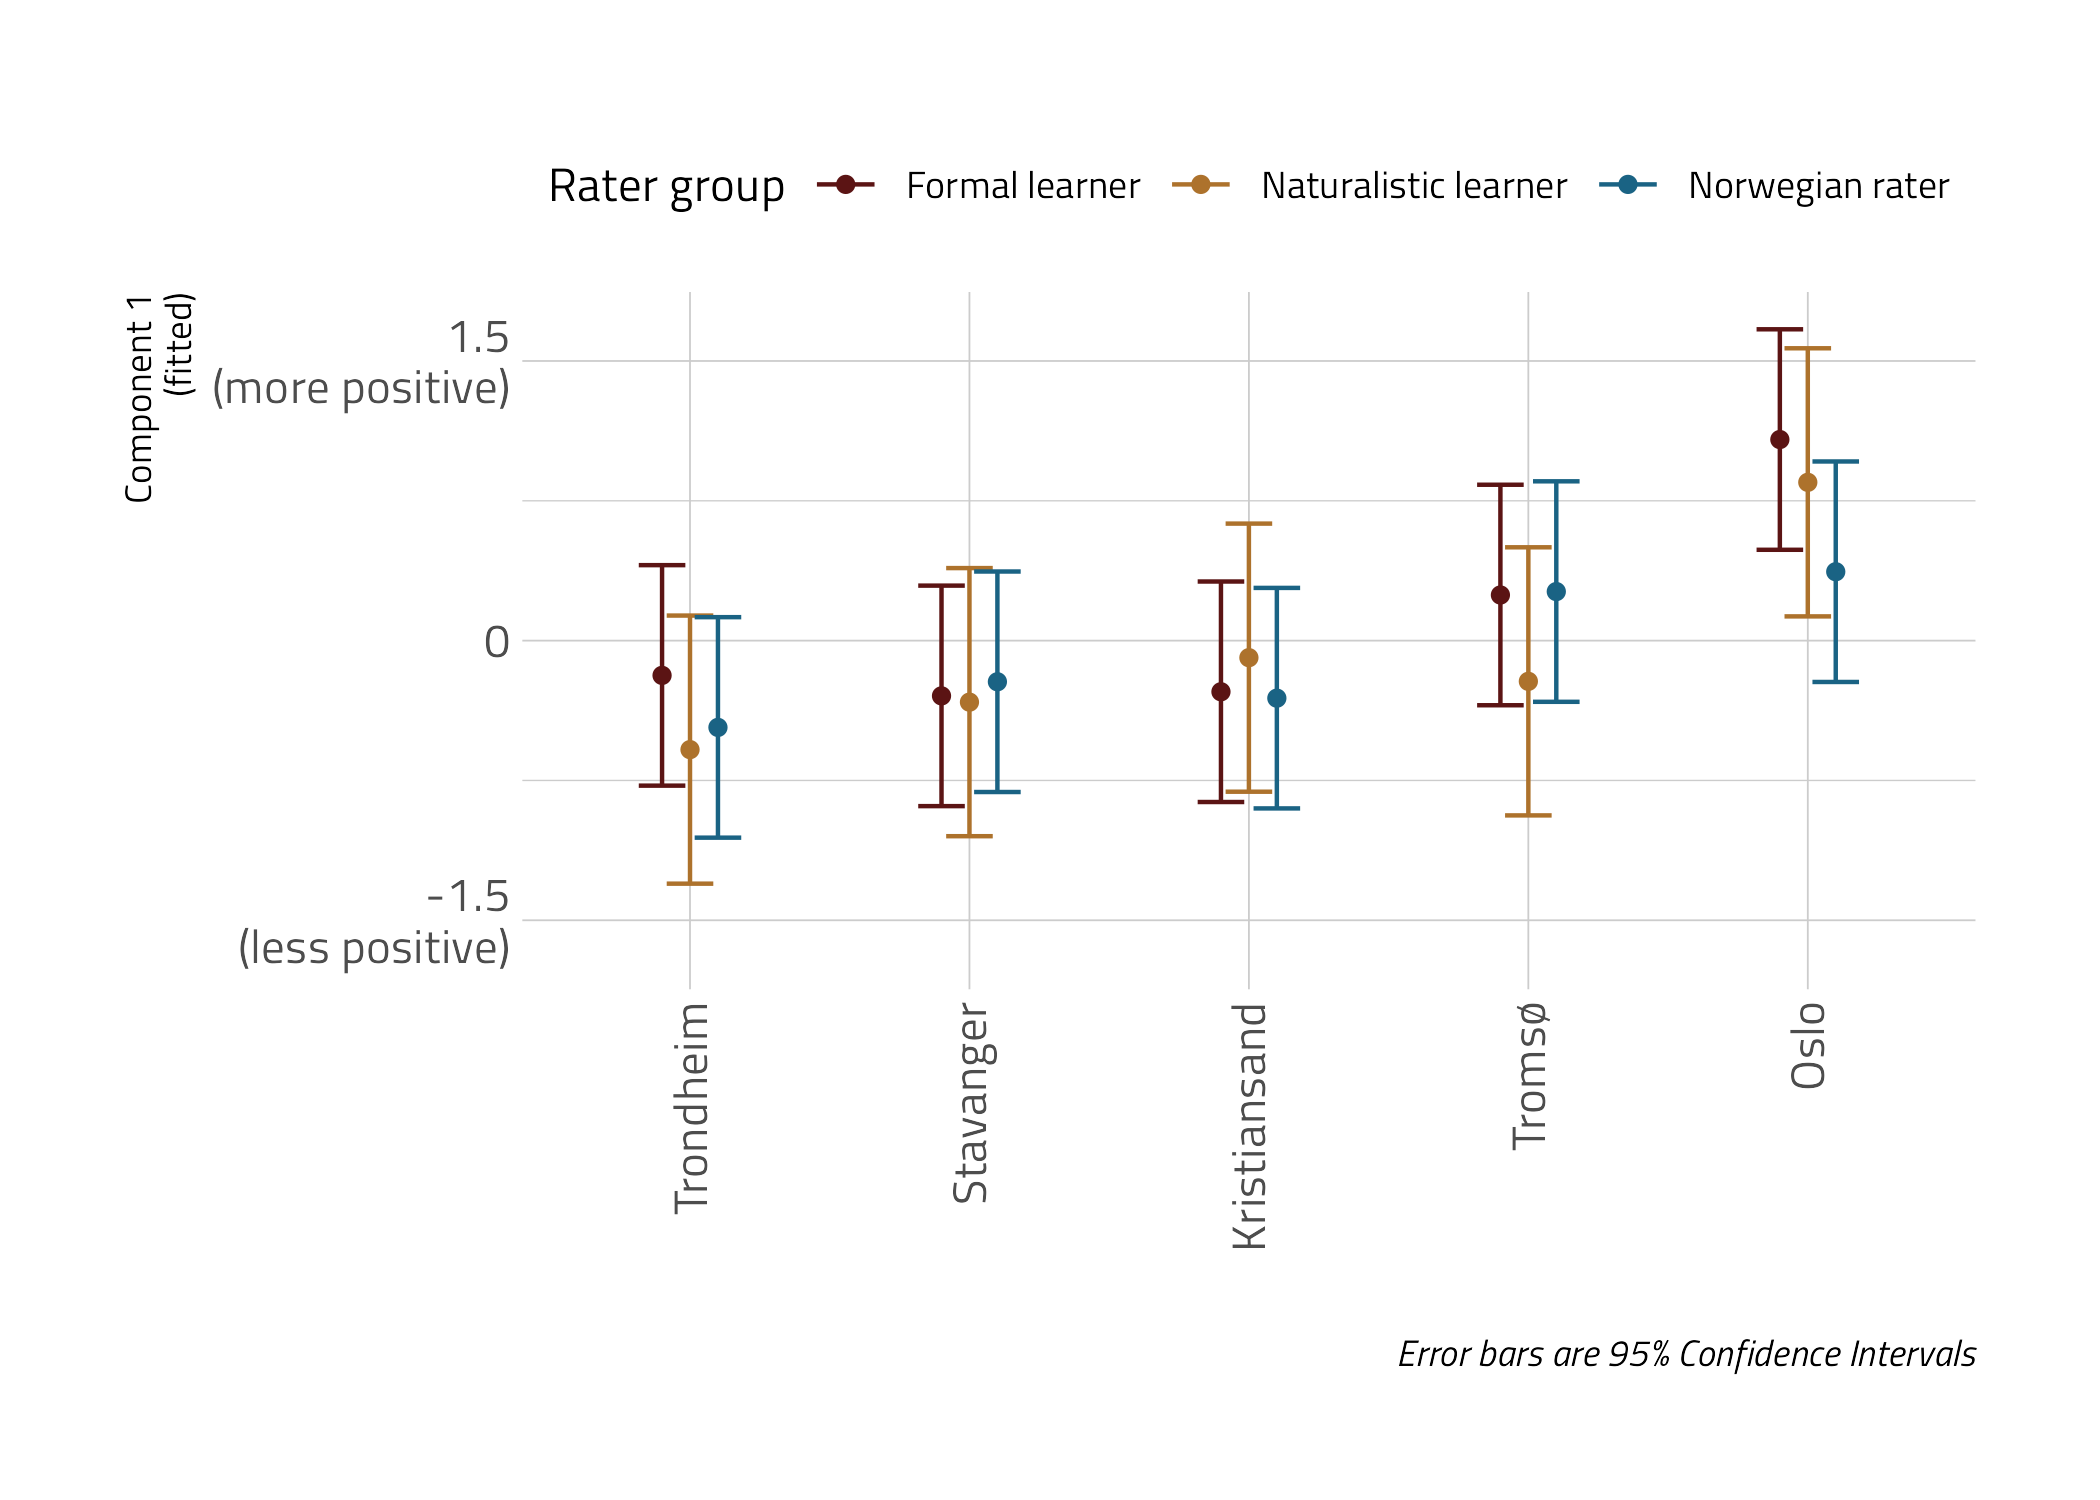
PCA :: Component 1
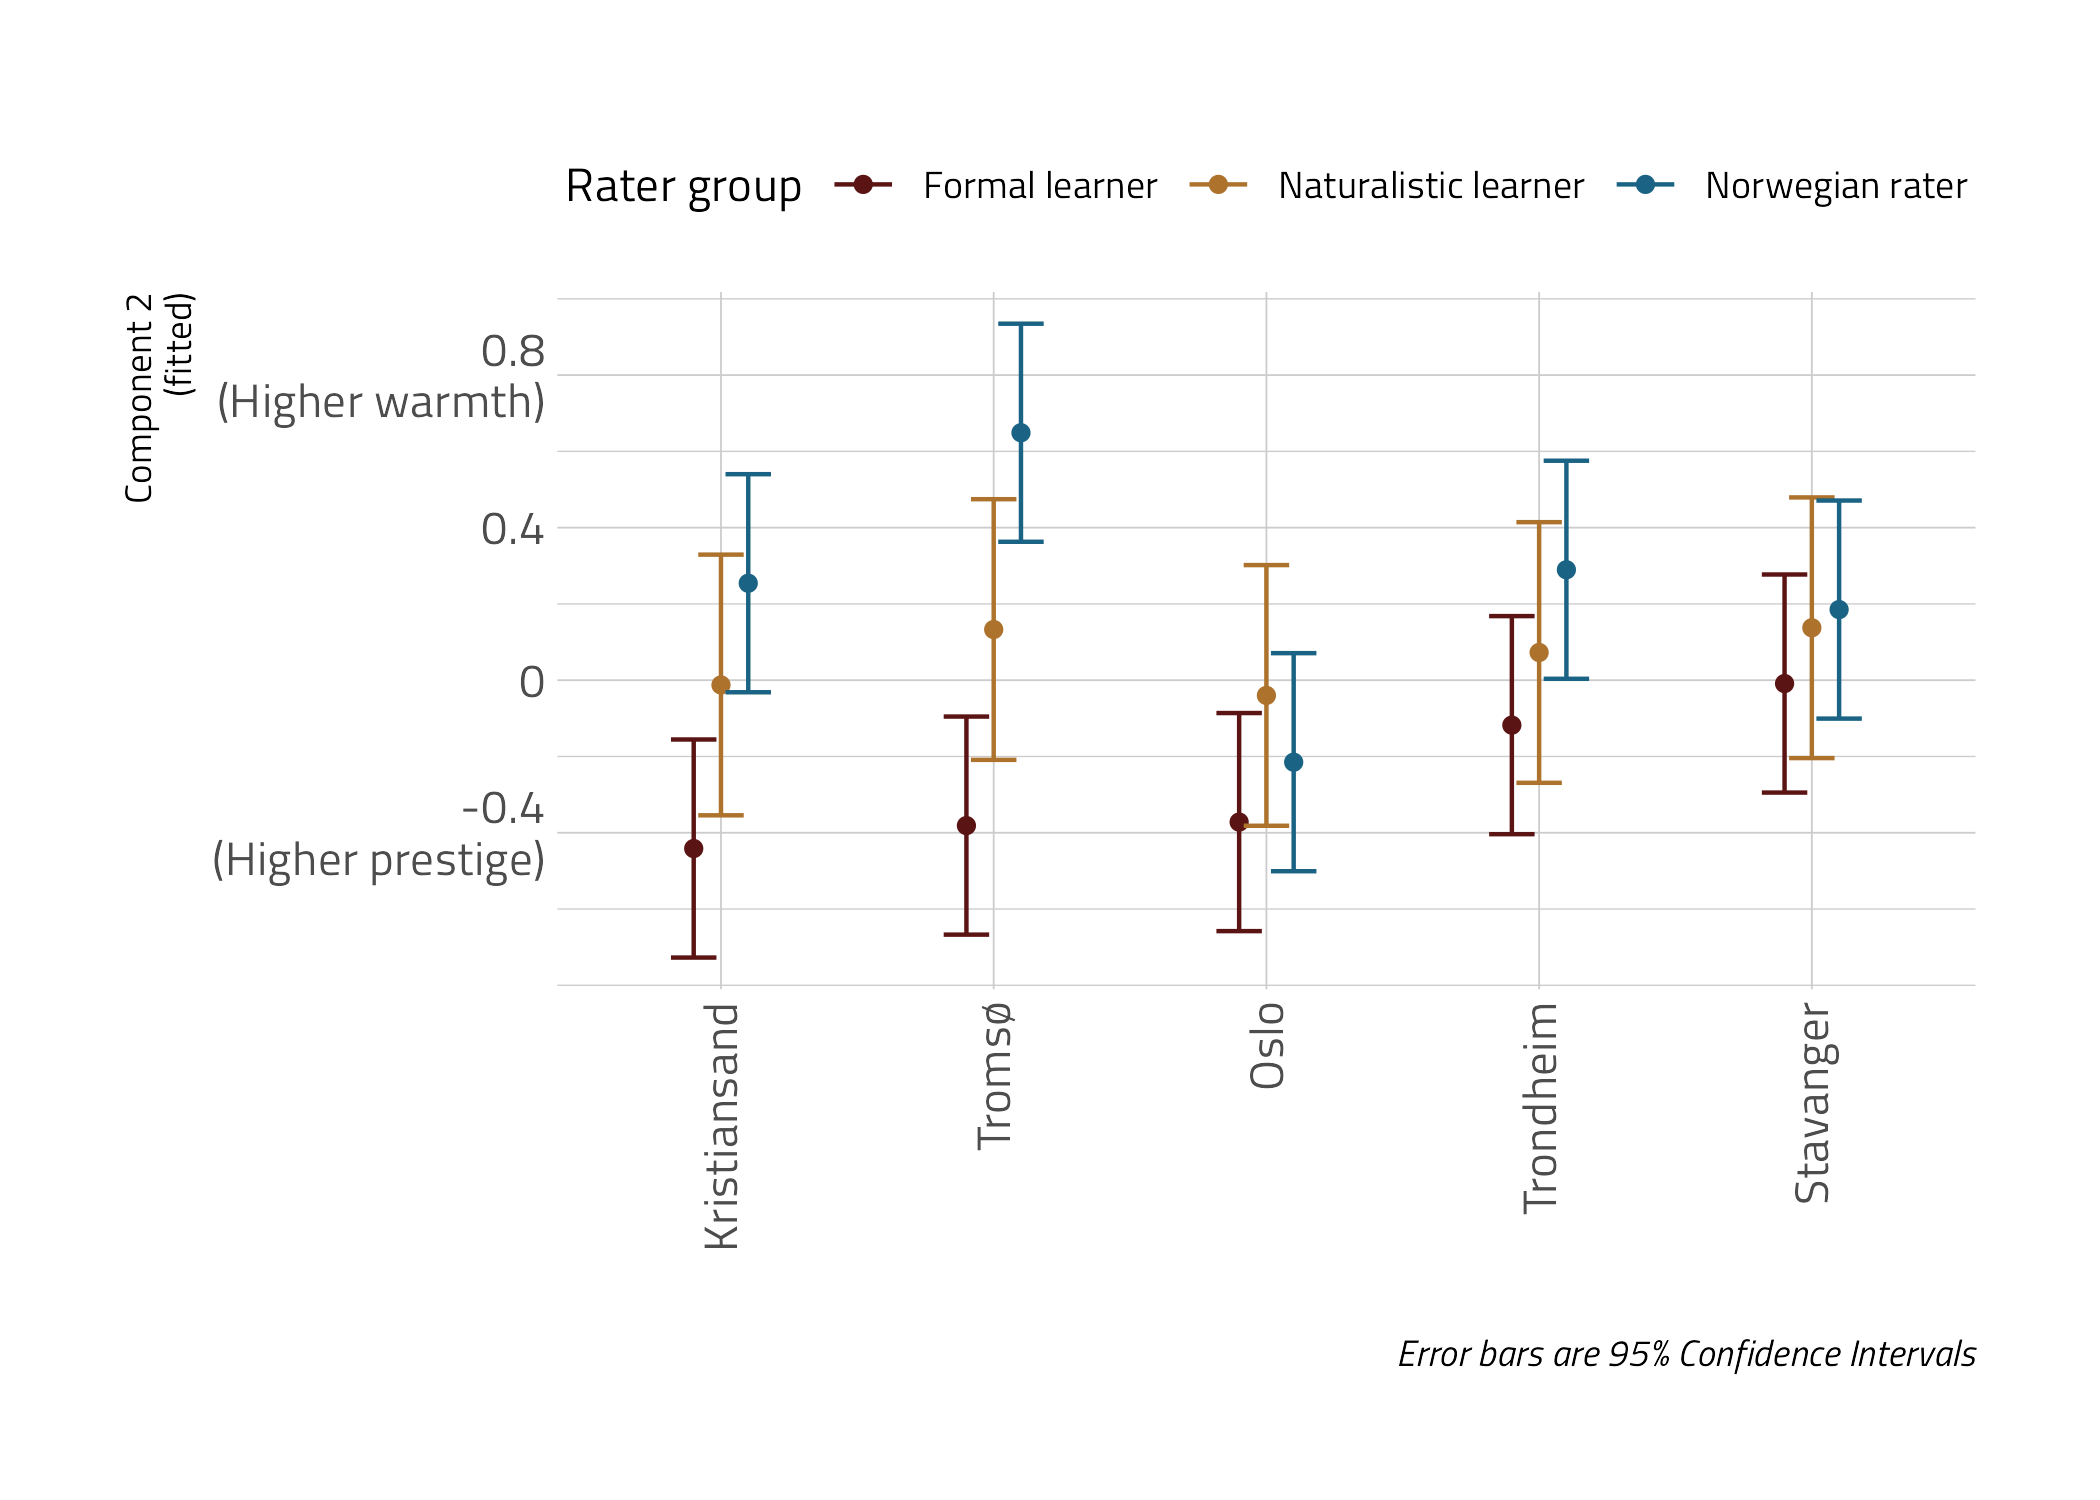
PCA :: Component 2
| trait | R² | p-value |
|---|---|---|
| friendly | 0.63 | < 0.001 |
| pleasant | 0.40 | < 0.001 |
| intelligent | -0.12 | < 0.001 |
| educated | -0.37 | < 0.001 |
| prestigious | -0.47 | < 0.001 |
Open answers (identification)
- The majority of correct identification came from the Norwegian native raters
- Few L3/Ln learners able to identify the place of origin
- Over 100 responses per voice
- Mandal :: (corr) : Mandal (2), Kristiansand (8), Flekkefjord (2), Vest-Agder (7), Sørlandet (22), (incorr) : Bergen (6), Stavanger (5)
- Kristiansand :: (corr) : Kristiansand (11), southern Norway (18), Vest-Agder (7), (incorr): Bergen (6), Stavanger (5), Trondheim (8), Hamar (2), Lindesnes (1), Hordaland (1), Førde (1)
Open answers (attitudes)
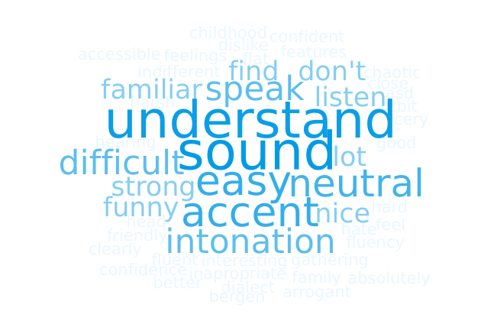
- In all cases, comments were :: positive > neutral > negative
- Over 100 comments for each accent
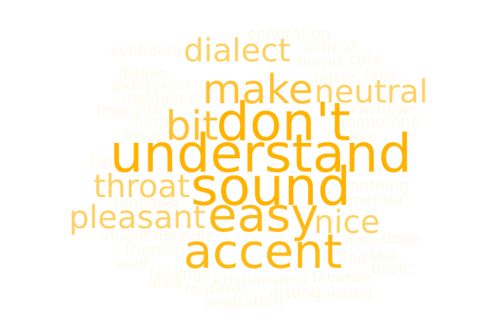
- Many listeners commented on uvular [ʁ] sounds when they occurred (Kristiansand, Mandal, Stavanger)
- Other features noticed: prosody, ka - hva replacement
- In general, comments on likes, dislikes, “flow”, “melody”, softness and friendliness
Trondheim
Mandal

Oppdal

Kristiansand
Discussion :: RQ1
- Some variation in how different Norwegian accents are perceived, but the differences are smaller than predicted
- Oslo accent evaluated as the most positive of all (see Component 1)
- Component 2: the higher an accent wrt warmth, the lower the prestige, e.g. the Tromsø accent
Discussion :: RQ2
- Reported differences between the three groups of raters
- Larger for Component 2 - perceived warmth and prestige for Tromsø and Kristiansand
- Differences in speech / reading rates controlled for
- No statistically significant difference in how male and female voices were perceived by the respondents
Discussion :: RQ3
- Accent origin identification proved challenging
- Native Norwegian raters > naturalistic learners > formal learners
- Only samples with a rather high success rate: Oslo accents
Conclusions
- Novel insights into accent perception both from the native Norwegian and multilingual perspective of language learners
- Different accents in Norway are given different aesthetic and social attributions
- Perceptions are aligned along different criteria
- With more exposure and social context, non-native speakers seem to be more inclusive towards accentual variation
- Potential implications for non-native pedagogy
Acknowledgments
Thanks to Jørn Almberg for access to the speech sample database and to Jacques Koreman for consultations.
This research is supported by Norway funds/NCN project grant GRIEG-1 (UMO-2019/34/H/HS2/00495) ADIM “Across-domain investigations in multilingualism: Modeling L3 acquisition in diverse settings”.

Thank you!
